Physical Address
42°26′05″N 83°59′06″W
Physical Address
42°26′05″N 83°59′06″W

Series: Noise to Signal Part: 2 of 5 Date: March 2026
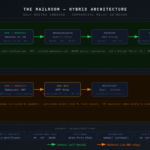
Part 1 covered the architecture – why the hardware is split the way it is, how the capture interface works, and what we’re actually trying to build. If you haven’t read it, the short version is: Security Onion standalone on a dedicated Proxmox host, a 10G NIC receiving mirrored traffic from the SFP+ uplink, and a VPS-hosted honeypot coming later to feed the platform real external data.
This part is the install. The Security Onion installer has strong opinions about your environment, and a few of them will catch you off guard if you go in cold. We’ll go through the Proxmox VM setup, the installer flow, the decisions it forces, and what the post-install state looks like before we’ve touched anything.
The SO installer expects specific hardware conditions. Getting those wrong means either a failed install or a working install that quietly doesn’t do what you think it does. Sort these out at the Proxmox level first.
Security Onion requires two separate network interfaces: one for management, one for capture. This is non-negotiable – the installer will not proceed without detecting a second interface.
Management NIC – standard virtio NIC bridged to your management network. This gets an IP, hosts the web UI, and is how you SSH in. Proxmox configuration: virtio, bridge=vmbr0.
Monitor NIC – this is the 10G SFP+ card receiving mirrored switch traffic, passed directly to the VM via PCIe passthrough. In Proxmox this shows up under Hardware as a PCI Device (hostpci0). It does not go through a vmbr bridge – it bypasses the hypervisor network stack entirely and appears to the VM as bare hardware.
If you’re doing this without a dedicated capture NIC, you have options – you can add a second virtio NIC to the VM and configure an OPNsense interface mirror or a software tap instead. It works, but 1G virtio on a virtual bridge is a meaningful downgrade from direct 10G hardware capture. For anything beyond a low-traffic home network, the hardware path is worth it.
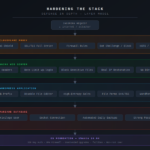
Security Onion 2.4 requires UEFI firmware. The installer will refuse a BIOS/legacy boot. In Proxmox:
The TPM is a hard requirement as of SO 2.4. Without it the installer exits early with a somewhat unhelpful error. Add it before you boot the ISO.
Set the CPU type to host with flags=+aes. The host passthrough gives the VM access to the full physical CPU feature set including AES-NI hardware acceleration, which matters for the volume of hashing and crypto operations SO runs continuously.
In Proxmox the CPU config line looks like:
cpu: host,flags=+aes
500GB is the allocation here. The OS itself is modest – SO is a relatively lean Oracle Linux base – but the Elastic index grows continuously as traffic is captured and logs ingested. The installer will ask about storage allocation during setup and the defaults are tuned for the hardware you’re running on.
| Component | Setting |
|---|---|
| Machine | q35 |
| BIOS | OVMF (UEFI) |
| CPU | host, flags=+aes |
| RAM | 24GB, balloon=0 |
| Disk | 500GB, VirtIO SCSI, SSD emulation on |
| EFI Disk | 4MB (auto-created with OVMF) |
| TPM | State device, version 2.0 |
| NIC 1 (management) | virtio, bridge=vmbr0 |
| PCI Device (capture) | hostpci0 – 10G SFP+ NIC, PCIe passthrough |
Download the Security Onion ISO directly from the Security Onion Solutions GitHub releases page. At the time of this install, the current version is 2.4.201.
# On the Proxmox host shell
wget https://github.com/Security-Onion-Solutions/securityonion/releases/download/2.4.201-20260114/securityonion-2.4.201-20260114.iso
Upload it to a Proxmox storage pool (local ISO storage works fine) and attach it to the VM’s CD/DVD drive. The CD/DVD drive needs to be on an IDE controller – ide2 is the conventional slot.
Boot the VM from the ISO. The first thing you see is a standard Oracle Linux installer – this is expected. Security Onion installs its own base OS before the SO-specific setup runs. The Oracle Linux portion is mostly automatic; the only things worth paying attention to:
Disk partitioning – the installer defaults to using the entire disk. Accept it. Manual partitioning for SO is not worth the complexity – the defaults are sensible and SO’s own services manage their data directories.
Network configuration during OS install – set a static IP for the management interface here. Using DHCP during install and switching to static afterward is possible but adds unnecessary steps. Set it correctly now: IP address, subnet mask, gateway, DNS.
Root password and admin user – the installer will create an initial admin user. This becomes your OS-level SSH account. This is separate from the SO web UI credentials, which you set later.
Once the OS install completes, the VM reboots and you’re dropped into a text-mode Security Onion setup wizard. This is where the real decisions happen.
The setup wizard walks through a series of choices that determine the deployment architecture. For a standalone homelab install most of these are straightforward, but a few deserve comment.
What would you like to do?
> Install
  Upgrade
Select Install.
What type of installation would you like to perform?
> STANDALONE
  DISTRIBUTED
  IMPORT
  EVAL
Select STANDALONE. This is the correct mode for a single-node deployment. EVAL is tempting because it implies “simpler,” but it’s a stripped-down configuration with reduced functionality – not what you want for an ongoing deployment. STANDALONE runs the full stack.
The wizard will detect and list available network interfaces. You need to identify which one is the management interface and which is the capture interface.
The management interface should show your static IP. Select it here. This is the interface SO will use for its web UI and administrative functions.
If you set a static IP during the OS install, this should pre-populate. Confirm:
x.x.x.111/24)securityonionlab is fineThe wizard will ask which interface(s) to use for traffic capture. Select the capture NIC here – the 10G PCIe passthrough interface. It should appear without an IP address assigned.
This is the interface SO will configure in promiscuous mode to receive the mirrored traffic from your switch. Do not assign it an IP. The whole point is that it’s invisible on the network – no IP, no ARP responses, nothing for an attacker to reach back to.
What type of authentication would you like to use?
> LOCAL
  LDAP
  SAML
Select LOCAL for a homelab. LDAP and SAML are enterprise integrations that require external infrastructure. LOCAL creates user accounts managed directly within SO.
You’ll then set the email address and password for the SO web UI admin account. This is separate from the OS-level admin user you created during the Oracle Linux install.
The wizard asks which hosts or networks should be allowed to access the SO web interface. This is an important security control – SO’s web UI should not be reachable from every device on your network.
Enter only the management workstation IP here: x.x.x.10/32 (your specific workstation, not the entire subnet). You can expand this later via OPNsense firewall rules, but locking it down at install time is the right default.
The wizard will ask about how to allocate disk storage across SO’s various data categories – Elastic indices, PCAP storage, and system logs. The defaults are calculated based on your available disk and are generally sensible.
One thing worth adjusting: the PCAP retention default is often lower than you’d want. If 500GB is your allocation, consider bumping the PCAP percentage to give yourself more packet capture history. The Elastic index can be more aggressive about rolling old data since the indexed metadata is more useful than raw PCAP for most analysis workflows anyway.
Before the wizard executes the setup, it presents a summary of all choices. Read through it. It takes 20-30 minutes to apply and there’s no clean undo – reverting means reimaging the VM.
Common things to double-check at this stage:
Once you confirm, the wizard runs. It pulls container images, configures services, sets up Elasticsearch indices, and does a significant amount of background work. On this hardware it takes roughly 20-30 minutes. You’ll see progress output scrolling – this is normal.
When the wizard finishes you’ll get a message along the lines of:
Setup is complete. You may now access the Security Onion web interface at:
https://[SO_HOST]
Before going to the browser, do a quick sanity check at the terminal.
sudo so-status
This lists all Security Onion services and their current state. On a fresh install everything should be green. The list is long – SO runs a lot of containers. Key ones to verify:
| Service | What It Does |
|---|---|
so-suricata | IDS rule matching against captured traffic |
so-zeek | Protocol analysis and connection logging |
so-elasticsearch | Index storage |
so-kibana | Visualization layer |
so-logstash | Log ingestion pipeline |
so-strelka | File extraction and analysis |
so-fleet | Elastic Agent management (for endpoints, later) |
If anything shows stopped or failed, check sudo so-logs <service-name> before going further.
sudo tcpdump -i <capture-interface> -c 20
This should immediately start showing packets if the port mirror is active and the capture interface is configured correctly. If you see nothing, the issue is either the port mirror configuration on the switch side or the interface assignment in SO.
At this point we haven’t configured the port mirror yet – that’s Part 3. But it’s useful to confirm the interface is visible to the OS and can receive traffic.
df -h
Verify the storage is allocated as expected. The data directories for SO are under /nsm/ – this is where PCAP files, Suricata logs, Zeek logs, and Elasticsearch data all live.
Navigate to https://[SO_HOST] from the management workstation. You’ll hit a certificate warning – SO uses a self-signed certificate by default. Accept it and proceed.
Log in with the email and password you set during the wizard. What you’re looking at:
Overview – high-level sensor status, alert counts, and recent activity. Empty for now since we haven’t started capturing traffic.
Alerts – the main SOC workflow interface. Where Suricata and Zeek alerts land and get triaged.
Hunt – free-form query interface against all indexed data. The most powerful part of the platform for actual investigation work.
Dashboards – pre-built Kibana dashboards for different data sources: DNS, HTTP, connections, alerts, and more.
PCAP – interface for pulling raw packet captures associated with specific sessions.
Grid – shows the sensor grid. On a standalone install, you have one node. As you add an IDH node or additional sensors later, they appear here.
The first-run state is quiet. The only things you’ll see in Alerts are possibly a few Suricata administrative notices and rule update logs. That’s expected – there’s no traffic yet. Part 3 is about changing that.
With SO up and running, take a minute in OPNsense to verify (or set) the access rules before moving on.
The rules you want:
Allow management workstation to SO web UI:
Source:      x.x.x.10 (workstation IP)
Destination: [SO_HOST]
Port:        443 (HTTPS)
Action:      Allow
Allow management workstation to SO SSH:
Source:      x.x.x.10
Destination: [SO_HOST]
Port:        2222
Action:      Allow
Block everything else to SO:
Source:      any
Destination: [SO_HOST]
Action:      Block
Before setting the SSH rule, verify which port sshd is actually listening on. From the Proxmox console run sudo ss -tlnp | grep ssh – on this install SSH remained on port 22, not 2222 as the Security Onion documentation suggests. The port may vary depending on your install configuration.
To be clear about where things stand at the end of this part:
No traffic is being captured. The port mirror on the switch hasn’t been configured yet. SO is running but the capture interface isn’t seeing anything meaningful. Part 3 covers the mirror configuration and validates that SO is actually seeing the traffic it should.
No alert rules are tuned. The default Suricata ruleset (Emerging Threats Open) is enabled, but it’s completely untuned for this environment. Once traffic starts flowing, you’ll get noise. Managing that noise is Part 5 territory.
No external data. The T-Pot honeypot VPS doesn’t exist yet. The platform right now is only capable of watching internal traffic. That changes in Part 4.
The post-install state is a functional, correctly configured platform waiting for data. That’s the right place to be at the end of Part 2.
A few things that can go wrong during this process worth documenting:
Installer refuses to start – “TPM not found” The TPM State device needs to be added in Proxmox before the first boot from the ISO. Adding it after the OS has installed requires a full reinstall. Add it before you attach the ISO.
Installer can’t find a second network interface Verify the PCIe passthrough NIC is correctly configured in Proxmox. Common issue: the hostpci0 entry needs pcie=1 in the options for proper passthrough rather than legacy PCI emulation. Also verify the NIC shows in the Proxmox hardware tab as a PCI Device, not a Network Device.
so-status shows Elasticsearch failed to start Usually a RAM issue. Elasticsearch needs headroom – if other processes are competing for the 24GB allocation, ES may fail to initialize its heap. Check sudo so-logs so-elasticsearch and look for OutOfMemoryError or heap size complaints. On a dedicated VM this shouldn’t happen, but background Proxmox overhead can occasionally be a factor.
Web UI unreachable after install Check OPNsense firewall rules first – the most likely culprit is the web access restriction either being misconfigured in the wizard or blocked at the firewall level. Verify you can reach the IP at all with a ping before concluding the SO web service is at fault.
Part 3 is where it gets interesting – configuring the port mirror, pointing SO at real traffic, and seeing what a monitored home network actually looks like before we start tuning anything.
Noise to Signal is a homelab series on building and operating a network security monitoring platform at home. Part 3: Getting Traffic In.
Tags: Security Onion, NSM, Homelab, Proxmox, Installation, Suricata, Zeek, IDS