Physical Address
42°26′05″N 83°59′06″W
Physical Address
42°26′05″N 83°59′06″W

Series: Noise to Signal Part: 3 of 5 Date: March 2026

Parts 1 and 2 covered the design decisions and the install. At this point Security Onion is running, all containers are green, and the web interface loads. The capture interface exists but nothing is flowing through it yet. The platform is running and waiting.
This part covers three things: telling SO which physical NIC to use for capture, configuring the port mirror on the switch, and verifying the whole pipeline is working end to end. There’s more friction here than Part 2 – this is where the physical and logical layers have to agree with each other.
Before touching anything, it’s worth understanding how Security Onion actually receives traffic – because the first instinct (point tcpdump at the physical NIC) isn’t how SO works.
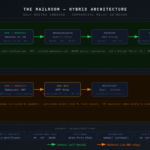
Security Onion creates a virtual bond interface called bond0 during installation. All capture tools – Suricata, Zeek, Stenographer – listen on bond0, not on the physical NIC directly. The physical capture NIC needs to be enslaved to bond0 to get traffic into the pipeline. This is by design and documented behavior, not a quirk.
The reason for this architecture: bond0 acts as a single logical capture point that can aggregate multiple physical interfaces. In a deployment where you’re tapping multiple switch uplinks or multiple SPAN ports, you add all of them to the bond and the capture stack sees a unified stream. For a single-NIC homelab setup it’s one-to-one, but the abstraction layer is the same.
After install, the physical capture NIC may not be added to bond0 automatically – particularly if the NIC wasn’t fully recognized during the setup wizard. You can verify this immediately with:
cat /proc/net/bonding/bond0
If the output shows no slave interfaces and MII Status: down, the bond is empty and nothing is being captured regardless of what the port mirror is doing.
Security Onion provides so-monitor-add specifically for this purpose. From the SO documentation:
“If you’ve already run through Setup but later find that you need to add a new monitor (sniffing) interface, you can run so-monitor-add. This will allow you to add network interfaces to bond0 so that their traffic is monitored.”
First, identify the name of your capture interface:
ip link show
Look for an interface that is state UP but has no IP address assigned. On a dual-port 10G card, one port will show UP (the one with the cable connected) and the other DOWN. Your interface name will vary based on the NIC model and PCIe slot.
Once you have the name, run:
sudo so-monitor-add <capture-interface>
A successful run looks like:
Connection 'bond0-slave-<interface>' successfully added.
Verify the bond came up:
cat /proc/net/bonding/bond0
ip link show bond0
bond0 should now show state UP and list your capture NIC as a slave interface. At this point SO’s capture stack has a live path to traffic – but only once the port mirror is also delivering that traffic to the NIC.
The OS network manager will treat the capture NIC like any other interface – sending DHCP requests, generating IPv6 traffic, and generally adding noise. Tell it to leave the interface alone:
sudo nmcli device set <capture-interface> managed no
Verify:
nmcli device status | grep <capture-interface>
Should show unmanaged. This is a quality-of-life fix for troubleshooting rather than a functional requirement, but it makes validating the mirror much cleaner.
Log into your switch management interface and navigate to the port configuration for the port physically connected to the SO capture NIC.
Set that port’s operation to Mirroring and point it at the uplink port as the mirror source. Most managed switches call this a Port Mirror or SPAN (Switched Port Analyzer) – the same concept regardless of vendor.
A few things worth knowing:
The mirror destination port will show no connected device in the switch UI. This is expected – the capture interface has no IP and never responds, so the switch sees no device on that port.
The mirror config may not survive a switch reboot. This is common behavior on consumer and prosumer managed switches. If the port light goes out or tcpdump shows no traffic after a restart, go back into the switch management UI, toggle the port back to Default, save, then set it back to Mirroring and save again. A full power cycle of the switch forces a clean reload of all port configs.
With the capture NIC added to bond0 and the port mirror configured, verify the whole chain is working before checking SO’s interfaces.
First confirm traffic is reaching the NIC itself:
sudo tcpdump -i <capture-interface> -c 20 -n not ether src <capture-interface-mac>
Get the MAC from ip link show. If the mirror is working you’ll see packets from other MAC addresses immediately – your router, workstations, other devices on the network.
Then confirm traffic is flowing through bond0 (which is what SO actually listens on):
sudo tcpdump -i bond0 -c 20 -n
If you see traffic on the physical interface but nothing on bond0, the NIC isn’t properly enslaved to the bond – run so-monitor-add again and check cat /proc/net/bonding/bond0.
If you see nothing on either interface:
Check the port mirror config applied. Toggle it off and back on in the switch UI.
Power cycle the switch. A full power cycle forces a clean config reload. If the light on the mirror destination port is off after a restart, this is usually the fix.
Check the physical connection. Re-seat the SFP+ modules at both ends. An intermittent connection can leave the NIC showing state UP on the SO side while delivering nothing.
Once bond0 has traffic flowing through it, give SO a few minutes to ingest. Then open the web interface.
Navigate to Dashboards and open the Overview. The timeline will show when traffic started flowing. The breakdown by event category shows what’s generating data – expect mostly SO internal traffic (identity management, Elasticsearch, system logs) at first, with the Zeek-driven network category building up as more traffic is indexed.
A few things become obvious when you look at a home network through this lens for the first time:
DNS is noisier than you’d expect. Every device is making DNS queries constantly. IoT devices especially – checking in with vendor cloud infrastructure, telemetry endpoints, NTP. The DNS logs show you exactly what every device is reaching out to by name.
Your IoT segment has opinions. Smart home devices, cameras, and printers poll home frequently. Seeing it logged is different from knowing it abstractly.
Zeek is already doing protocol analysis without any configuration. It identifies HTTP, DNS, SSL/TLS, and other protocols and logs connection metadata – source IP, destination IP, destination port, bytes, duration – for every session crossing the router.
Navigate to Alerts. On a fresh install monitoring a quiet home network, the first alerts will be internal SO events – authentication notices, administrative Suricata messages, anything generated during the setup process. This is expected and normal.
What you probably won’t see yet: actual network attack signatures, exploit attempts, or malware callbacks. Your home network is quiet in that sense. This is the whole reason the honeypot comes in Part 4.
Navigate to Hunt and try a few queries. The syntax is Kibana Query Language (KQL).
All DNS queries:
event.dataset: "zeek.dns"
All connections to external IPs:
event.dataset: "zeek.conn" AND NOT destination.ip: 10.0.0.0/8 AND NOT destination.ip: 192.168.0.0/16
All unencrypted HTTP:
event.dataset: "zeek.http"
Hunt is where you’d spend most of your actual analysis time. Getting comfortable with KQL transfers directly to any other Elastic-based SIEM.
Part 1 mentioned that intra-VLAN traffic doesn’t appear in the capture because it never crosses the router. Now that SO is live this is worth making concrete.
Take two devices on the same VLAN and have them communicate. That conversation won’t appear anywhere in SO – not in Zeek, not in Suricata, not in PCAP. As far as SO is concerned it didn’t happen.
This matters because lateral movement between hosts on the same subnet is exactly what an attacker does after gaining a foothold. At enterprise scale this is addressed with host-based agents that report process and network activity regardless of whether traffic crosses a monitored boundary. That’s on the roadmap for Part 5.
Knowing what you can’t see is as useful as knowing what you can.
sudo so-status
All containers should remain green after traffic starts flowing. This is the same command from Part 2 – it’s the primary SO health check and worth running any time something seems off.
Before any tuning, before the honeypot, before deliberately introducing interesting traffic – spend a day or two just watching. Note what normal looks like:
This baseline matters. Once you start tuning rules and adding external data sources, having a clear picture of what day-one looked like makes it much easier to identify what changed and why. It’s the same reason a real SOC documents baseline behavior before deploying new detection logic.
At the end of Part 3, Security Onion is fully operational as an internal network monitor. The bond interface has a live capture NIC enslaved to it, the port mirror is delivering traffic, Zeek is logging every connection crossing the router boundary, Suricata is running signatures, and the analyst interface gives you a working environment.
What’s still missing is data volume and variety. The home network is quiet. The platform is working but there isn’t much to act on.
That changes in Part 4. We spin up a VPS, deploy the T-Pot honeypot stack, and pipe real internet adversary traffic into the same Security Onion instance. Within 24 hours of going live the alert queue looks completely different.
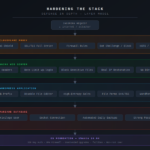
bond0 shows no slave interfaces and MII Status: down after install The capture NIC wasn’t added to the bond during setup. Run sudo so-monitor-add <interface> with the name of your capture NIC. See the SO documentation at docs.securityonion.net/en/2.4/so-monitor-add.html.
tcpdump on bond0 shows nothing but tcpdump on the physical NIC shows traffic The interface isn’t properly enslaved to the bond. Run cat /proc/net/bonding/bond0 and check the slave list. Re-run so-monitor-add if the interface isn’t listed.
tcpdump shows nothing on either interface The port mirror isn’t delivering traffic. Toggle the mirror config off and back on in the switch management UI. Power cycle the switch if the port light is off.
Hunt shows no Zeek data after traffic is confirmed flowing Check the time range in your query – allow a few minutes of ingestion lag after the mirror first goes live. Also verify bond0 is UP with ip link show bond0.
Web UI or SSH times out SO has a host-based firewall separate from your network firewall. Your analyst IP needs to be in the allowed hosts list. From the SO console: sudo so-firewall includehost analyst <your-ip> then sudo so-firewall apply. For ongoing management of allowed hosts, use Administration > Configuration > firewall > hostgroups in the web UI.
Noise to Signal is a homelab series on building and operating a network security monitoring platform at home. Part 4: Feeding It Real Data.
Tags: Security Onion, NSM, Homelab, Zeek, Suricata, Port Mirror, Network Monitoring, bond0