Physical Address
42°26′05″N 83°59′06″W
Physical Address
42°26′05″N 83°59′06″W

Author: Collin Series: Noise to Signal Part: 4 of 5 Date: April 2026
Parts 1 through 3 got Security Onion running, capturing home network traffic, and indexing it. The monitoring stack is working. The problem is there is not much to monitor. A home network is quiet by design – clean traffic, predictable patterns, and days can go by without anything worth looking at.
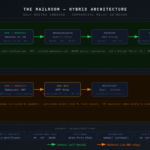
This part changes that. We deploy a VPS-hosted honeypot that deliberately attracts internet adversary traffic, connect it to Security Onion using the Elastic Agent, and end up with a platform actively ingesting real attack data around the clock – credential brute forces, vulnerability scans, malware droppers, and occasionally manual intrusion attempts.
[Internet attackers]
        |
        v
[VPS - public IP - DigitalOcean]
  T-Pot honeypot containers
  Elastic Agent
        |
        | Encrypted log shipping (port 5055)
        v
[Security Onion - STANDALONE]
  Logstash receives and processes
  Elasticsearch indexes
  Same SOC interface
        |
        | also ingesting
        v
[Home network mirror - bond0]
The VPS has zero network path back into the home network. No VPN, no tunnels, no shared credentials. The only data flow is outbound from the VPS into SO’s Logstash listener. If the honeypot gets compromised – and eventually it will – the blast radius is one throwaway VPS.
T-Pot is a Docker Compose orchestration layer that manages a collection of honeypot containers. It normalizes log output across all containers into a consistent format that integrates cleanly with Elastic. Rather than stitching together different log formats from multiple projects, you get one coherent data stream.
T-Pot ships with its own bundled Elastic stack. That is redundant here since Security Onion is the pane of glass. T-Pot runs as a pure sensor – honeypot containers producing logs, Elastic Agent shipping those logs to SO.
| Option | Name | Description |
|---|---|---|
| H | Hive | Full installation – all honeypots plus local Elasticsearch, Logstash, and Kibana. Requires 16GB RAM minimum |
| S | Sensor | Honeypots only, designed to ship to a T-Pot Hive node. No local Elastic stack |
| L | LLM | AI-generated responses (Beelzebub, Galah). Requires Ollama or ChatGPT subscription |
| i | Mini | 30+ honeypots with minimal resource footprint. Right choice for this setup |
| M | Mobile | For use with the T-Pot Mobile companion app |
| T | Tarpit | Feeds endless data to attackers and bots. Includes DDoS honeypot |
For this setup, select i (Mini).
Official T-Pot documentation specifies:
| T-Pot Type | RAM | Storage |
|---|---|---|
| Hive | 16GB | 256GB SSD |
| Sensor | 8GB | 128GB SSD |
Source: github.com/telekom-security/tpotce#system-requirements
Since Security Onion handles all log storage and search, T-Pot’s local Elastic stack is redundant. Mini runs 30+ honeypot daemons without bundled Elasticsearch competing for RAM. The DigitalOcean $24/month droplet (4GB RAM, 2 vCPU, 80GB SSD, 4TB transfer) works for Mini with 2GB of swap configured. Swap is a required step – without it the system will OOM kill processes under load.
AWS and Azure both charge approximately $0.087-0.09/GB outbound after a 100GB free tier. For a busy honeypot this adds up quickly and unpredictably. DigitalOcean includes large outbound transfer allowances in its base plans.
For this setup we are using DigitalOcean at $24/month.
This is the step most guides skip – and it costs hours if you do it out of order. The SO Elastic Agent installer bakes in the Fleet server address and SSL certificate at download time. If SO doesn’t know about your public IP before you generate the installer, the cert won’t include it and enrollment will fail with an x509 error regardless of how well your firewall rules are configured.
In the SO Console: Administration > Configuration > elasticfleet
Click the Options menu at the top and enable Show advanced settings.
Navigate to elasticfleet > config > server > custom_fqdn and set it to your home public IP address (the IP the VPS will use to reach SO through your OPNsense NAT). Save it.
By default, SO writes your public IP into the cert as a DNS SAN rather than an IP SAN. This causes x509 validation failures because an IP address in a DNS field doesn’t match when connecting by IP. Fix it by overriding the SSL Salt state:
sudo cp /opt/so/saltstack/default/salt/ssl/init.sls /opt/so/saltstack/local/salt/ssl/init.sls
Edit line 167 of that file to change DNS: to IP: for the custom_fqdn entry:
sudo sed -i 's/,DNS:{{ ELASTICFLEETMERGED.config.server.custom_fqdn | join/,IP:{{ ELASTICFLEETMERGED.config.server.custom_fqdn | join/g' /opt/so/saltstack/local/salt/ssl/init.sls
sudo sed -i "s/join(',DNS:')/join(',IP:')/g" /opt/so/saltstack/local/salt/ssl/init.sls
Verify the change:
sudo grep -n "subjectAltName" /opt/so/saltstack/local/salt/ssl/init.sls | grep elastic
Should show IP:{{ ELASTICFLEETMERGED not DNS:{{ ELASTICFLEETMERGED.
Delete the existing cert and force Salt to regenerate it:
sudo rm /etc/pki/elasticfleet-server.crt
sudo salt-call state.apply ssl queue=True
Verify the new cert includes your public IP as a proper IP SAN:
sudo openssl x509 -in /etc/pki/elasticfleet-server.crt -noout -text | grep -A3 "Subject Alternative"
Should show IP Address:[YOUR_PUBLIC_IP] in the output.
sudo docker restart so-elastic-fleet
Verify the container is actually serving the updated cert:
sudo openssl s_client -connect 127.0.0.1:8220 </dev/null 2>/dev/null | openssl x509 -noout -text | grep -A3 "Subject Alternative"
Confirm IP Address:[YOUR_PUBLIC_IP] appears. If it still shows DNS:[YOUR_PUBLIC_IP] the container hasn’t picked up the new cert – restart it again and recheck.
Only now that the cert is correct should you download the installer. From the SO Console, navigate to Downloads and download the Linux amd64 Elastic Agent installer. This is a custom SO-packaged installer with your Fleet server address and cert pre-baked in.
Provision a new droplet on DigitalOcean. Ubuntu 22.04 LTS. $24/month tier (4GB RAM, 2 vCPU). Use SSH key authentication.
This order is critical. The SSH key must be copied to the new user before disabling root login – otherwise you lose SSH access and need the recovery console to fix it.
Note: adduser admin fails on Ubuntu because the admin group already exists. Use a different name.
adduser [ADMIN_USER]
usermod -aG sudo [ADMIN_USER]

# Copy SSH key BEFORE anything else
mkdir -p /home/[ADMIN_USER]/.ssh
cp /root/.ssh/authorized_keys /home/[ADMIN_USER]/.ssh/
chown -R [ADMIN_USER]:[ADMIN_USER] /home/[ADMIN_USER]/.ssh
chmod 700 /home/[ADMIN_USER]/.ssh
chmod 600 /home/[ADMIN_USER]/.ssh/authorized_keys
Open a new terminal and confirm you can connect as [ADMIN_USER] on port 22 before proceeding. Do not close the existing root session until this works.
sudo sed -i 's/PermitRootLogin yes/PermitRootLogin no/' /etc/ssh/sshd_config
# Ubuntu uses 'ssh' not 'sshd' for the service name
sudo systemctl restart ssh
Required before T-Pot install. Without it the system will OOM kill processes on a 4GB droplet:
sudo fallocate -l 2G /swapfile
sudo chmod 600 /swapfile
sudo mkswap /swapfile
sudo swapon /swapfile
echo '/swapfile none swap sw 0 0' | sudo tee -a /etc/fstab
free -h
Swap row should show 2.0Gi.
Copy the CA cert from SO and install it on the VPS before running the agent installer:
sudo nano /usr/local/share/ca-certificates/so-ca.crt
# Paste the contents of /etc/pki/ca.crt from your SO box
sudo update-ca-certificates
The T-Pot installer cannot be run as root and must be run from the user’s home directory:
su - [ADMIN_USER]
cd ~
pwd
# Must show /home/[ADMIN_USER]
Run the installer:
env bash -c "$(curl -sL https://github.com/telekom-security/tpotce/raw/master/install.sh)"
When asked for installation type enter i for Mini.
The installer will:
Update your local SSH config after reboot:
Host honeypot
    HostName [VPS_PUBLIC_IP]
    User [ADMIN_USER]
    Port 64295
    IdentityFile C:\Users\[USER]\.ssh\id_ed25519
Verify T-Pot is running after reboot:
sudo systemctl status tpot
sudo docker ps --format "table {{.Names}}\t{{.Status}}"
free -h
All containers should show Up status and memory should be stable with swap absorbing overflow.
The VPS needs to reach SO on ports 8220 and 5055 through your home router. Add a destination NAT rule in OPNsense:
Firewall > NAT > Port Forward:
Interface:    WAN
Protocol:     TCP
Source:       [VPS_PUBLIC_IP]
Destination:  WAN address
Dest Port:    8220, 5055 (alias recommended)
Redirect IP:  [SO_HOST]
Redirect Port: 8220, 5055
Filter rule:  Pass (set in Advanced settings)
Setting the filter rule association to Pass is important – OPNsense won’t automatically create a matching WAN pass rule otherwise, which results in state violation drops even when NAT translation is working.
Add the VPS IP to the elastic_agent_endpoint hostgroup:
sudo so-firewall includehost elastic_agent_endpoint [VPS_PUBLIC_IP]
sudo so-firewall apply
The so-firewall apply command updates the Salt pillar but does not automatically write DOCKER-USER iptables rules for external IPs. Add them manually:
sudo iptables -I DOCKER-USER 1 -s [VPS_PUBLIC_IP] -p tcp --dport 8220 -j ACCEPT
sudo iptables -I DOCKER-USER 2 -s [VPS_PUBLIC_IP] -p tcp --dport 5055 -j ACCEPT
Verify connectivity from the VPS:
curl -v --connect-timeout 10 https://[YOUR_PUBLIC_HOME_IP]:8220
You should see SSL certificate verify ok and subjectAltName: host matched cert's IP address. If you get a cert SAN mismatch go back to Phase 1 and confirm the cert was regenerated correctly and the Fleet container was restarted.
Transfer the installer downloaded in Phase 1 to the VPS. Note the non-standard SSH port:
scp -P 64295 so-elastic-agent_linux_amd64 [ADMIN_USER]@[VPS_IP]:~
On the VPS:
chmod +x ~/so-elastic-agent_linux_amd64
sudo ~/so-elastic-agent_linux_amd64
The installer will attempt enrollment to your public IP on port 8220. Watch for:
Starting enrollment to URL: https://[PUBLIC_IP]:8220/
If it shows an internal IP (192.168.x.x) instead, you downloaded the installer before setting custom_fqdn. Go back to Phase 1, set the FQDN, regenerate the cert, and download a fresh installer.
Verify enrollment succeeded:
sudo systemctl status elastic-agent
sudo elastic-agent status
Both fleet and elastic-agent should show HEALTHY.
In SO Hunt, run:
agent.name: "Honey-Pot-Host"
If events appear, the pipeline is working. Within the first hour of T-Pot being exposed, you will see SSH credential stuffing attempts from Cowrie, protocol probes from Heralding, and general scanner traffic hitting every open port.
Cowrie (SSH/Telnet): Automated credential stuffing – bots cycling through username/password combinations. Cowrie logs credentials attempted, commands run after simulated successful login, and malware download attempts.
Heralding: Credential capture across FTP, HTTP, SMTP, Telnet. Breadth over depth.
Dionaea: Malware capture. Exploit attempts against SMB, HTTP, and FTP result in actual malware samples being submitted to the honeypot, logged with hashes and metadata.
General scanner traffic: The majority of what you will see. Every public IP gets probed eventually.
Useful Hunt queries:
agent.name: "[VPS_HOSTNAME]"
event.dataset: "cowrie.events" AND event.action: "login.failed"
Having both data sources in the same platform is what makes this more than a curiosity. When a source IP shows up in your honeypot logs, you can immediately check whether that IP has also appeared in your home network traffic. The correlation is the point – two visibility layers feeding the same search interface.
At the end of Part 4, Security Onion is ingesting data from two sources: the home network mirror via bond0, and a public-facing honeypot via Elastic Agent. The platform has a continuous feed of real adversary behavior to work with.
Part 5 covers the SO IDH node for internal deception, Suricata rule tuning against real data, and an honest look at what this homelab setup actually teaches versus what it cannot replicate from an enterprise environment.
Noise to Signal is a homelab series on building and operating a network security monitoring platform at home. Part 5: Making It Useful.
Tags: Security Onion, NSM, Homelab, T-Pot, Honeypot, Elastic Agent, Threat Intelligence, DigitalOcean