Physical Address
42°26′05″N 83°59′06″W
Physical Address
42°26′05″N 83°59′06″W

Series: Noise to Signal Part: 1 of 5 Date: March 2026
There’s a version of the homelab that’s just a fancy media server with some self-hosted apps bolted on. That’s fine. But if you work in security — or want to — there’s a more interesting question underneath all the VLAN configuration and firewall rules: how close can you actually get to enterprise security operations on a homelab budget, and does the attempt teach you anything real?
That question is what this series is about.
Not “Security Onion is great, here’s how to install it.” You can find fifty of those. This is a more honest look at what it means to build a functional Network Security Monitoring setup at home — what enterprise concepts actually translate to the homelab context, where the analogy breaks down, and what you end up learning from the attempt regardless.
The short version of where we land: it’s more useful than you’d expect, less glamorous than the marketing suggests, and the process of building it teaches you things that just running it never would.
Before anything else, let’s be precise about what Security Onion is, because it’s easy to mistake it for an IDS and stop there.
Security Onion is a Linux distribution built around a stack of open-source network security monitoring tools — Suricata for intrusion detection, Zeek for protocol analysis and connection logging, the Elastic Stack for search and visualization, and a web interface that ties it together. Recent versions add their own orchestration layer and alert management on top.
The key word is monitoring, not just detection. An IDS alerts on known bad signatures. A full NSM platform captures and indexes network metadata — every DNS query, every connection, every protocol exchange — so you can reconstruct what happened, not just that something triggered a rule. That distinction matters a lot when you’re thinking about what you’re actually trying to build here.
In a real SOC, the equivalent is usually some combination of a SIEM, a network sensor, and an analyst workflow connecting them. The tools are more expensive, data volumes are orders of magnitude larger, and there are people whose entire job is watching dashboards and triaging alerts. Security Onion compresses that whole stack into one platform a single person can run on hardware that cost a few hundred dollars used. That compression is both its strength and the thing that limits the analogy.
Security practitioners talk a lot about lab environments for skill development. What they usually mean is: spin up some VMs, generate some synthetic malicious traffic, run some tools against it. Controlled, reproducible, and not particularly representative of what you’d see in a real environment.
What’s more interesting is monitoring traffic from a network you actually use every day. Real DNS queries. Real connection patterns. Real noise. IoT devices polling home, NTP syncs, the background chatter of everything connected doing its thing. That data environment has more in common with what you’d work with professionally than any synthetic lab.
But here’s the problem with monitoring only your own home network: it’s clean. Suspiciously clean. The threat surface is small, the traffic is predictable, and you can go days without seeing anything remotely interesting. That’s the opposite of a SOC environment, where the challenge isn’t finding traffic — it’s making sense of it.
So the series takes a different approach. Rather than just monitoring inward, we deliberately feed the platform real adversarial traffic from outside. More on that in a moment.
The enterprise parallel isn’t “we built a miniature replica of a datacenter.” It’s: what does it look like to actually operate a monitoring platform, even at small scale? What decisions does it force you to make? What questions does it surface that you wouldn’t have thought to ask? Some of those decisions turn out to be identical to enterprise decisions scaled down. Some don’t translate at all. Part of what makes this interesting is figuring out which is which.
The Security Onion VM lives on a Lenovo ThinkCentre M720q — the second of two Proxmox hosts in this environment — dedicated entirely to security monitoring workloads. The primary Proxmox host handles everything else: reverse proxy, dashboard, home automation.
That separation is intentional. Security Onion is not light on resources, and the official minimums are conservative — once the Elastic stack starts indexing real traffic, you’ll be glad you weren’t sharing compute with anything else. Putting it on its own host also isolates failure modes. If the monitoring stack falls over, nothing else goes with it.
The VM is allocated:
| Resource | Allocation | Notes |
|---|---|---|
| CPU | 4 cores (host passthrough) | AES-NI enabled via [host,flags=+aes] |
| RAM | 24 GB | Elastic stack is hungry |
| Storage | 500 GB SSD | Index retention fills up faster than you’d think |
| Firmware | UEFI + TPM 2.0 | Required by the SO installer |
The [host,flags=+aes] flag in the Proxmox CPU config gives the VM direct access to AES-NI hardware acceleration. This matters because a significant portion of what SO is doing involves hash operations, encrypted traffic analysis, and signature matching. Soft-emulated AES is noticeably slower under load.
The 500GB disk covers the OS plus Elastic index storage. Security Onion lets you configure retention windows — how far back your packet captures and indexed logs go. On a home network with modest traffic volume, 500GB gives you months of retention at full fidelity. That would be laughable at enterprise scale, but for this use case it’s more than adequate.
Security Onion offers several deployment modes ranging from a single standalone node to distributed deployments with dedicated sensor, manager, and search nodes. For a homelab, standalone is the right answer without much deliberation.
In standalone mode, one machine does everything: captures traffic, runs Suricata and Zeek, indexes the results, hosts the web interface, and handles alert management. The tradeoff is that all those workloads compete for the same resources. In a real deployment handling dozens of sensors and petabytes of data, you’d split these roles across dedicated hardware. Here, 24GB of RAM and 4 cores handles all of it without complaint.
The version here is Security Onion 2.4.201, running on Oracle Linux Server 9.7 — which is what the SO installer drops on the hardware, not something you choose separately.
The Security Onion VM has two network interfaces. That’s not optional — SO requires them:
Management interface — carries the web UI, SSH access, and administrative traffic. This interface has an IP address and is how you actually interact with the system.
Monitor interface — captures traffic. This interface deliberately has no IP address and is not reachable from the network. It just listens.
The management interface sits on the Management LAN — the x.x.x.0/24 subnet where all infrastructure in this environment lives: both Proxmox hosts, OPNsense, AdGuard Home. The SO web UI is accessible at https://[SO_HOST]. Firewall rules restrict access to that address to a single designated workstation on the trusted VLAN. Everything else is blocked.
Placing the management interface on the Management LAN rather than a user VLAN is a deliberate hygiene choice. If SO were on the same VLAN as workstations, every device on that VLAN would have network-level access to it. Firewall rules can mitigate that, but keeping the topology clean is easier to reason about and audit.
OPNsense Router [GATEWAY_IP]
    |
Management LAN [MGMT_SUBNET]
    |
    ├── Proxmox Primary [PRIMARY_HOST]
    ├── Proxmox Secondary [SECONDARY_HOST]
    │       └── Security Onion VM [SO_HOST]
    │               ├── eth0 / Management → [SO_HOST]
    │               └── eth1 / Monitor → [no IP — capture only]
    ├── AdGuard Home [DNS_HOST]
    └── OPNsense [GATEWAY_IP]
This is the part most Security Onion guides gloss over. You need a copy of network traffic delivered to the monitor interface without disrupting actual traffic flow. There are a few ways to do this; some are cleaner than others.
The approach here uses the SFP+ uplink port on the UniFi switch — the fiber link carrying all traffic between the switch and the OPNsense router. That link is the chokepoint through which all inter-VLAN and internet-bound traffic passes. Port mirroring that interface means Security Onion sees essentially everything: cross-VLAN communication, internet-bound flows, DNS queries, all of it.
The M720q has a 10G NIC (a PCIe card with an SFP+ port) matched to the fiber uplink speed. This NIC is passed directly to the Security Onion VM via PCIe passthrough — it shows up as hostpci0 in the Proxmox VM hardware configuration. Passthrough gives the VM direct hardware access without going through the hypervisor’s virtual switch layer, which matters for capture reliability at higher traffic rates.
UniFi Switch
    ├── SFP+ Uplink → OPNsense (production traffic — unaffected)
    └── Port Mirror (copy of all uplink traffic)
            ↓
        10G SFP+ NIC (PCIe passthrough to SO VM)
            ↓
        Security Onion Monitor Interface [no IP — passive only]
Why mirror the uplink rather than a SPAN port further inside the network? The uplink is the single highest-value tap point — all internet traffic and all inter-VLAN traffic passes through it. The 10G capacity means the mirror can handle the throughput without dropping frames. And it positions the capture point at the network boundary, which is where you’d place a sensor in an enterprise environment.
The tradeoff worth naming: traffic that stays entirely within a single VLAN — one device on [TRUSTED_VLAN] talking to another on the same segment — never crosses the router and won’t appear in the capture. You’re missing intra-VLAN lateral movement. In an enterprise with a full fabric SPAN, you’d catch that. Here, you see everything that crosses the firewall boundary, which is the higher-signal data anyway.
This is the honest part most homelab NSM guides skip.
A home network is quiet. Genuinely, usefully quiet — but that creates a monitoring problem. When nothing is happening, you don’t know if your detections work. When something does happen, you have no baseline to compare against. Alert tuning requires volume. Threat hunting requires something to hunt. If you want to actually develop analyst skills rather than just maintain a platform, you need data.
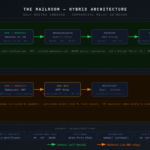
The solution is to deliberately introduce a second data source: a honeypot exposed to the public internet that feeds its logs into the same Security Onion stack. Now you have two complementary visibility layers:
The internet will find an exposed honeypot within minutes to hours. Scanners continuously index the entire IPv4 space. A fresh IP with open ports gets credential stuffers, malware droppers, vulnerability scanners, and occasionally manual operators — all of it real, all of it logged, all of it searchable in the same interface as your internal network data.
That second layer is what turns this from a monitoring platform into something you can actually learn from every day.
T-Pot is the platform we’ll use. Despite the name, it’s not a single tool — it’s a Docker Compose orchestration layer that manages a collection of individual honeypot containers, each emulating a different service or protocol. Pick which containers you want to run, and T-Pot handles the rest: networking, logging, restarts.
The container menu includes things like:
Critically, T-Pot’s own bundled Elastic stack is redundant here because SO is the pane of glass. The architecture is T-Pot as a pure sensor — honeypot containers only, logs shipped outbound to SO via Filebeat — and SO as the single place where everything lands and gets correlated.
[VPS — T-Pot honeypot containers, no local Elastic]
        |
        | Filebeat → encrypted log shipping
        ↓
[Security Onion — single pane of glass]
        |
        | also ingesting
        ↓
[Internal network mirror — home traffic]
On cloud provider choice: The honest answer is that the egress billing model matters more than brand name for this specific use case. AWS and Azure charge per GB outbound — typically $0.08-0.09/GB. A honeypot that’s actively responding to probes generates continuous outbound traffic you have no ceiling on. DigitalOcean and Vultr include 1TB/month outbound in their base plans, which is effectively free for this purpose.
That said, AWS specifically adds something DO doesn’t: a cloud-native security layer you can instrument alongside the honeypot. CloudTrail, VPC Flow Logs, GuardDuty — these are the tools you’d encounter in a real cloud environment, and shipping them into SO alongside honeypot data adds a meaningful dimension. The egress problem is manageable with billing alerts and sensible retention limits.
The plan here is to start with a $12/month DigitalOcean droplet (2 vCPU, 2GB RAM) running Cowrie and Heralding — enough to start seeing real traffic without the operational complexity of a full T-Pot deployment. As the series develops, we’ll add protocols, potentially migrate to AWS to fold in cloud-native logging, and evaluate geographic distribution (the same attacker infrastructure hitting sensors in different regions is its own data point).
Safety and isolation: The VPS is the airgap. Zero network path from the honeypot back into the home infrastructure. No VPN tunnel, no management access from home IPs if avoidable. The only data flow is outbound: logs shipping from the VPS to SO. If the honeypot gets compromised — and eventually it will — the blast radius is one throwaway VPS with no credentials or access to anything sensitive.
There’s a third piece that most Security Onion guides don’t mention, because it’s a relatively recent feature: Security Onion has a native Intrusion Detection Honeypot (IDH) node type.
Rather than running an external tool, you join a lightweight VM to your existing SO deployment and it runs OpenCanary — a modular honeypot that emulates HTTP, FTP, SSH, and other services internally. Any interaction with those services triggers an alert directly in SO’s interface. No separate logging pipeline, no Filebeat config, no Kibana dashboard to maintain separately.
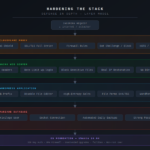
The key design insight for an IDH is where you place it. Drop it on a VLAN or subnet where no real device should ever be communicating. Place it in the Management LAN, or in a quiet unused segment. Any probe of that node is automatically high-confidence — there is no legitimate reason for anything to be talking to it. Zero false positives by design.
This maps directly to enterprise deception deployment practice: put a fake asset somewhere real assets don’t belong, and any interaction is inherently suspicious. It’s a trip wire, not a monitoring system.
The IDH node requires minimal resources and joins a standalone deployment cleanly. It’s its own part of the series.
Five parts:
Part 1 (this one) — Design and architecture. The why before the how. Hardware decisions, network placement, the monitoring philosophy, and what we’re actually trying to build.
Part 2 — Installation walkthrough. The SO installer has opinions and some of them will fight you. We go through the actual installation process, the decisions the installer forces, and what the post-install state looks like.
Part 3 — Getting traffic in and validating visibility. Configuring the port mirror, confirming SO is seeing what it should be seeing, and the early Suricata and Zeek output. This is where theory meets reality.
Part 4 — Feeding it real data. T-Pot deployment on a VPS, the Filebeat-to-SO pipeline, and what the first 24 hours of internet adversary traffic actually looks like flowing into your dashboard.
Part 5 — Making the platform useful. The SO IDH node, Elastic Agent on endpoints, custom Suricata rules, alert tuning, and an honest assessment of what you learn from running this versus just knowing it exists.
One thing worth being direct about upfront: the goal here is not to build a system that catches sophisticated targeted attacks on your home network. That’s not a realistic threat model for most people, and even if it were, a homelab NSM setup wouldn’t be the primary defense.
The goal is to build something that generates real data, forces real operational decisions, and builds genuine familiarity with the tools and workflows that matter in professional security work. Reading Zeek logs is a transferable skill. Understanding what normal traffic looks like makes anomalies obvious. Tuning rules and managing alert fatigue is exactly the work a real SOC analyst does. Troubleshooting why a sensor isn’t seeing traffic teaches you how traffic actually moves.
And with the external honeypot in the mix, the platform isn’t just watching a quiet home network — it’s ingesting continuous real-world adversary behavior from the internet, correlated in the same interface as your internal visibility. That combination is a more honest representation of what a monitoring platform actually does than any synthetic lab exercise.
Part 2 starts with the installer.
Noise to Signal is a homelab series on building and operating a network security monitoring platform at home. Part 2: Installation and Initial Configuration.
Tags: Security Onion, NSM, Homelab, Security, IDS, Zeek, Suricata, Honeypot, Proxmox